From time to time, I like to write about the fun stuff in Business Central. You know — those moments where curiosity meets “oh no, what have I done?” This time, I played around with Analysis Mode. Spoiler alert: if you follow my steps carefully, you might just manage to kill the session… or in extreme cases, the entire browser. 🚑💻
Being the curious type, I wondered:
How many offerings are there on AppSource for Business Central? And more importantly, how many offerings does each partner have. I wanted to sort them on offerings count.
Naturally, I thought: “Pivot tables should solve this in no time.”
So, off I went, armed with nothing but curiosity (and perhaps too much confidence).
The Recipe for Chaos
- Search for the page called Microsoft AppSource apps (just hit Alt+Q).

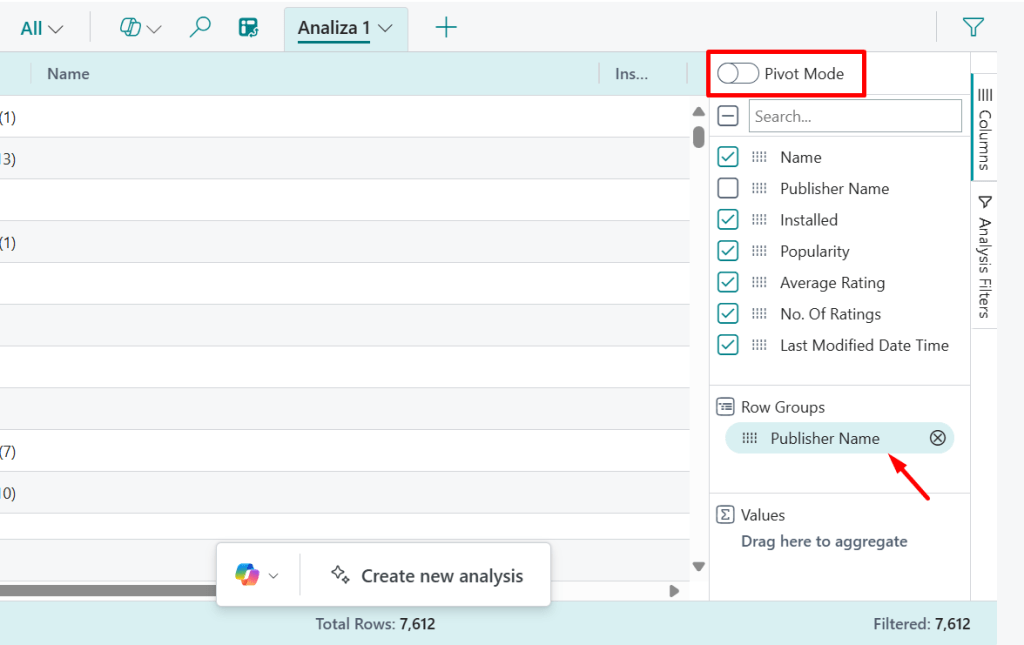
- Notice that Export to Excel is not available. Fine. No problem. Enter Analysis Mode.

- Make sure Analysis Mode is NOT in Pivot mode (yet). Keep only Publisher Name in Row Groups.
- Now… switch to Pivot mode.
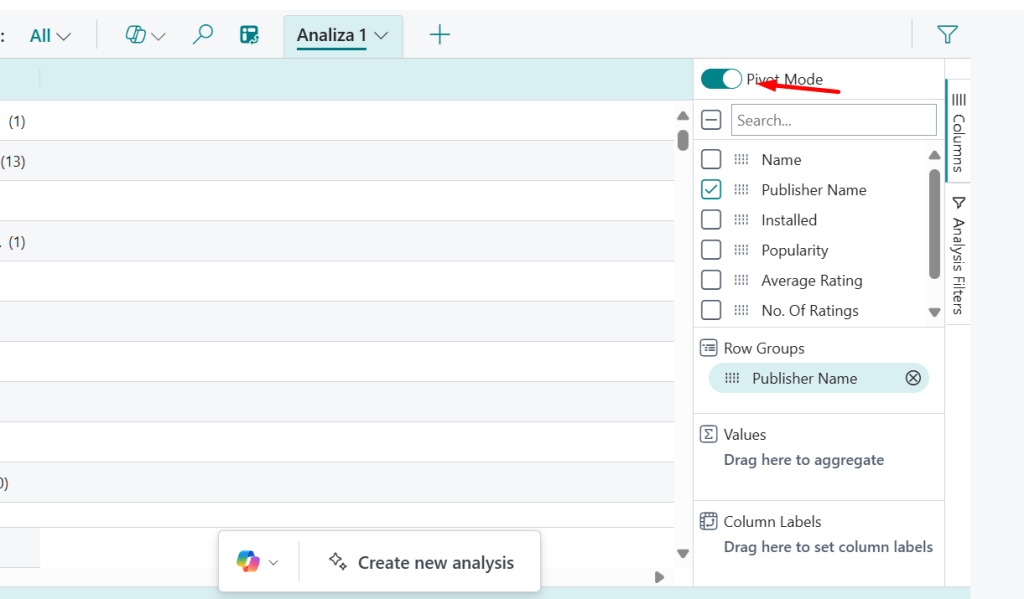
- Drag the Name field to Column Labels.

What Happens Next
At this point, I know I’m being mean. Asking Business Central to handle thousands of columns for hundreds of rows in Pivot mode is like asking your toaster to cook a five-course dinner.
The result?
- Best case: A frozen session.

- Worst case: RIP Business Central. Maybe even RIP Browser.
But hey — isn’t breaking things the true spirit of curiosity? 😉
The Not-So-Grand Finale
So… did I actually find out how many offerings each partner has on AppSource?
Nope. Not even close.
Instead, I discovered a brand-new way to stress-test Business Central’s Analysis Mode and my browser’s patience. The original question remains unanswered, but the journey was—let’s say—educational (and slightly destructive).
Moral of the story: sometimes curiosity doesn’t lead to answers… it just leads to the Task Manager. 😉
